
ETF Expense Ratios Explained for Beginners

One of the biggest challenges for beginner investors isn’t choosing an ETF - it’s knowing how to compare them once you actually find them.
Most people start investing by hearing ticker symbols online:
VOO, SPY, IVV, VTI, SCHD…
But then comes the confusing part:
“How do I actually compare ETF expense ratios?”
Because most people hear “Low expense ratios are important.”
…but nobody explains where to start or what you’re even supposed to look at.
Here’s the simple process I use inside the ETF Expense Ratio Comparison Sheet in my $1M Investing Roadmap
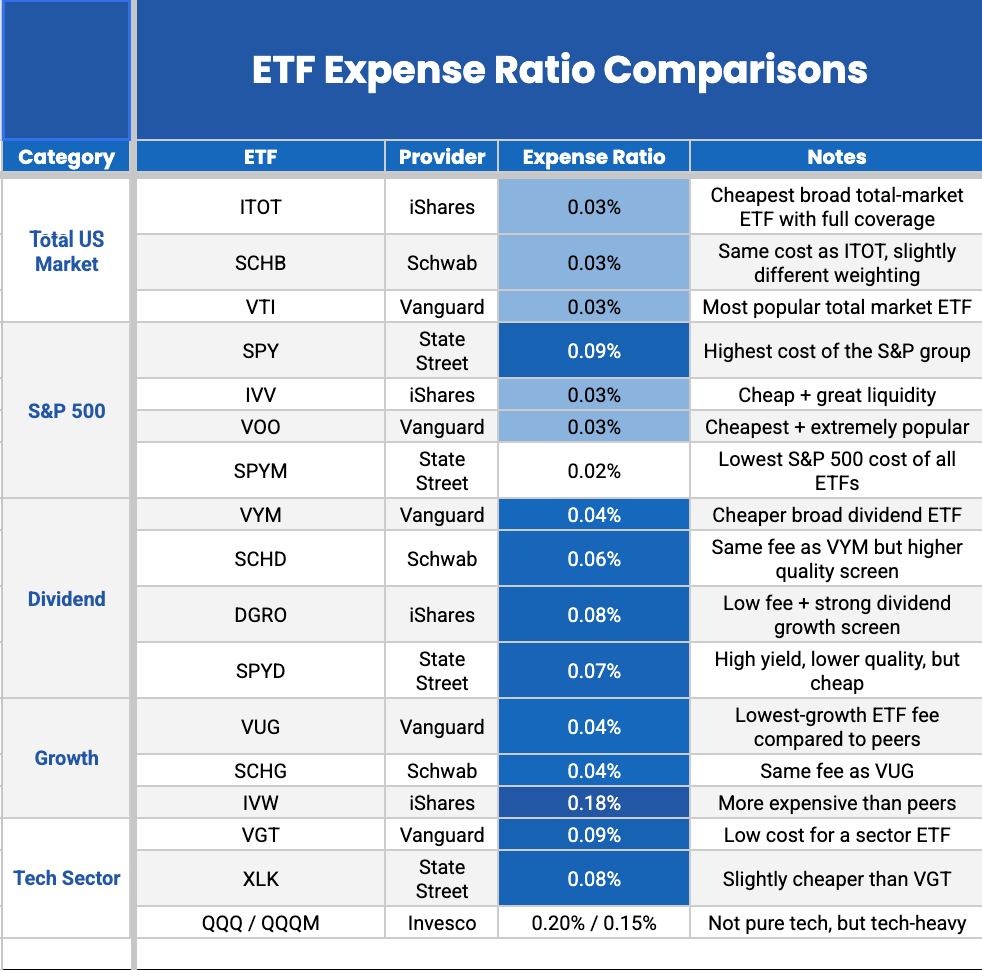
First, look at what the ETF tracks.
If two ETFs track the same index or very similar parts of the market, that’s when expense ratios become more important to compare.
For example:
VOO, SPY, and IVV all track the S&P 500
VTI, SCHB, and ITOT all track the broader U.S. stock market
That immediately helps you see which ETFs are actually trying to accomplish the same thing.
Then look at the expense ratio.
An expense ratio is the annual fee charged by the fund company to manage the ETF. It’s usually small, but over long periods of time, those fees can compound just like investment returns do.
So if two ETFs are very similar, beginners can use the sheet to compare:
Which one has the lower fee
Who manages the fund
What index it tracks
And whether the differences actually matter for their goals
That’s the part I think a lot of people miss when they first start investing.
It’s not just about finding a popular ticker symbol. It’s about understanding why you’re choosing one ETF over another.
I built my $1M investing roadmap to make that learning process feel clearer and less intimidating. Dont forget to check out some of the other tabs, like the “Beginner Portfolio Table” and “High Dividend Paying Fund Comparisons.”
If you want the full $1M Investing Roadmap for free, you can grab it below ↓